| 1. | Hydrogen and iodine gas react to form hydrogen iodine in a reversible reaction: H2 (g) + I2 (g) ↔ 2 HI(g) Concentrations of the reaction participants were recorded over time as the system reached equilibrium. This data is recorded in the following chart: |
||||||||||||||||||||||||
|
|||||||||||||||||||||||||
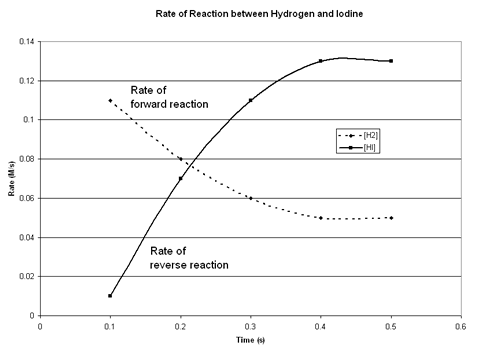
Graph the change in concentration of [H2] and [HI] over time. Plot the concentration of both substances on the same graph. Concentration (M) will be on the y-axis and Time (s) will be the x-axis. It is recommended that you use a spreadsheet program such as Excel or QuatroPro to create your graph, but you may create the graph by hand on graph paper if you like. If you’re not sure how to use a spreadsheet to create a graph you may should check out the hints and tips on using Excel (see the link in the sidebar on the right) or you may want to get some help from a local expert. When using Excel, you'll often want to select "X-Y Scatter" as the graph type, not a Line graph. Your finished graph should look similar to the following. Remember to include a title for your graph and labeled axes: |
|||||||||||||||||||||||||
 |